Weather Analysis
To make effective irrigation decisions, a grower has to know exactly what has and will happen with respect to the weather, as accurately as possible. On-farm monitoring and easy access to the data and related analyses are the optimal solution.
The maps and tools below aid in interpretation of the site-specific data collected and forecast for each station location in the TurfMonitor.com network. They are designed to help you make smart and efficient irrigation decisions by turning numbers into pictures that “make the data dance".
“Live Data” (NSGA Members Only)
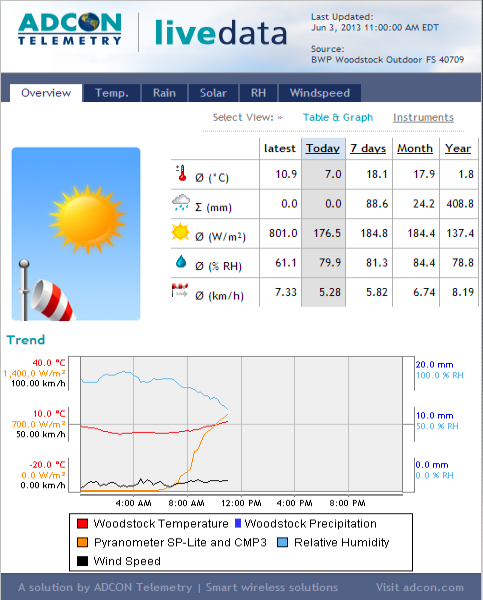
- Near-real-time reporting of weather conditions
- Numerical or dashboard views
- Daily, weekly, monthly & yearly composite data
- Tabs for each parameter with detailed display
Daily Rainfall Map, Observed, Historic & Forecast Weather
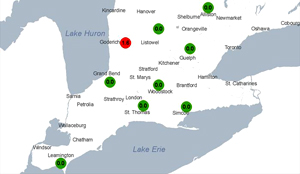
- Map shows the 24-hr precipitation totals from each station, as of midnight each night
- Default view displays yesterdays readings
- Date selectable for as far back as data exists
- Click each location for station-specific detailed weather observations, forecasts and historical data (see below)
Station-Specific Recent Weather Overview
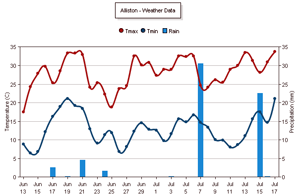
- A look back at the location’s weather
- Daily recorded precipitation, high and low temperatures from the station
- Useful view for examine recent trends, extreme weather events
Station-Specific Historical Weather Data
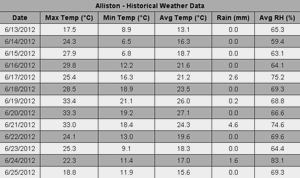
- One month’s recorded data from each station
- Daily high, low and average temperature, rainfall and average relative humidity
- Presented in raw chart form for those who prefer it or wish to use for further analysis
ONturf Blog Posts
Nov 15, 2017:
 Pub 384 Protection Guide for Turfgrass – 2017 version now available!
Mar 23, 2017:
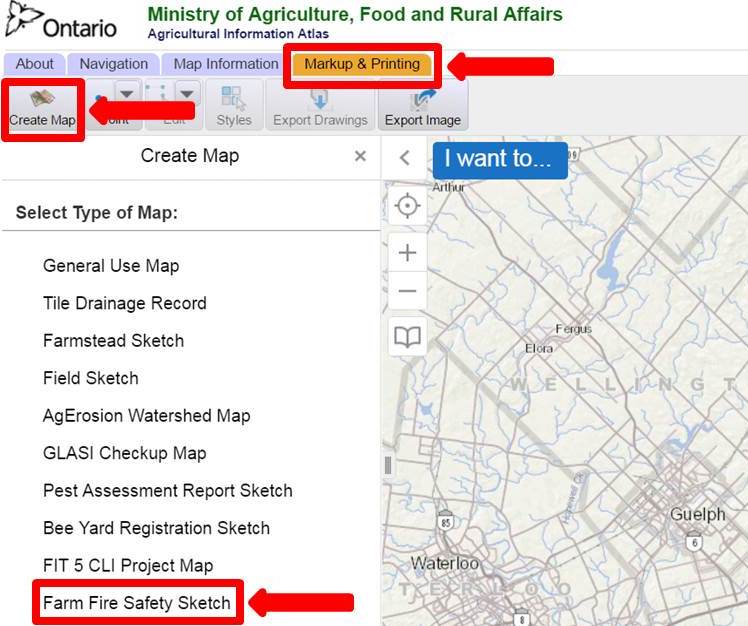 Did you hear? We’ve made great improvements to the Agricultural Information Atlas!
Dec 13, 2016:
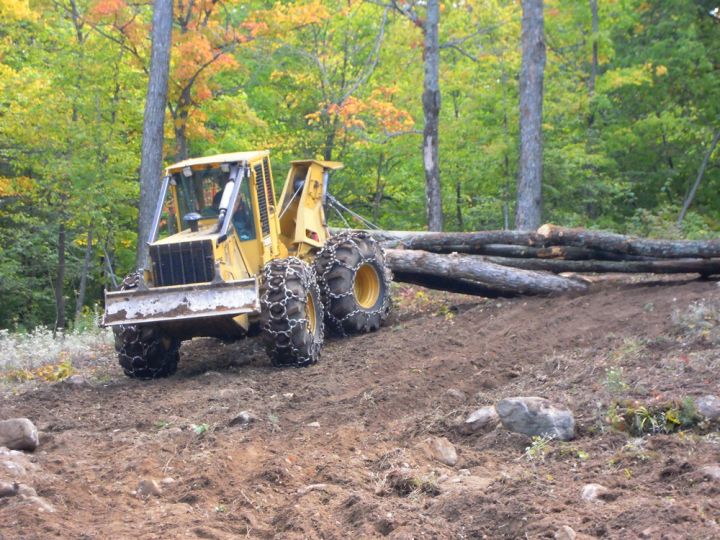 Call Before You Cut
Jun 13, 2016:
 Do you want to increase crop yields and reduce soil erosion?
Mar 23, 2016:
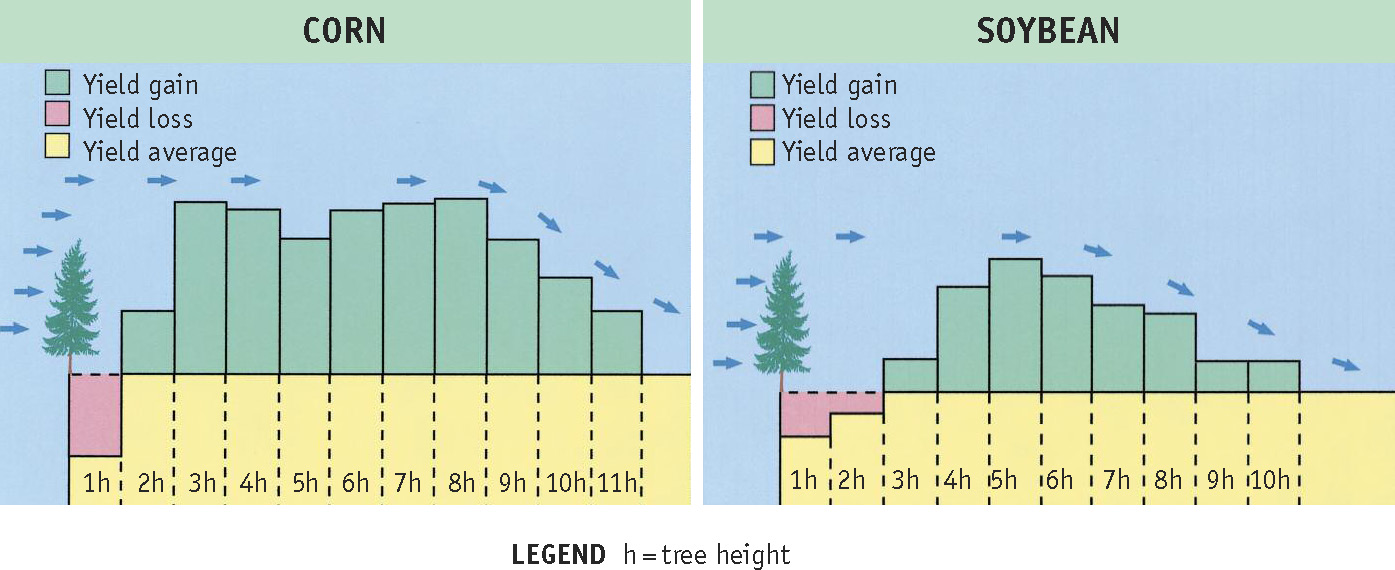
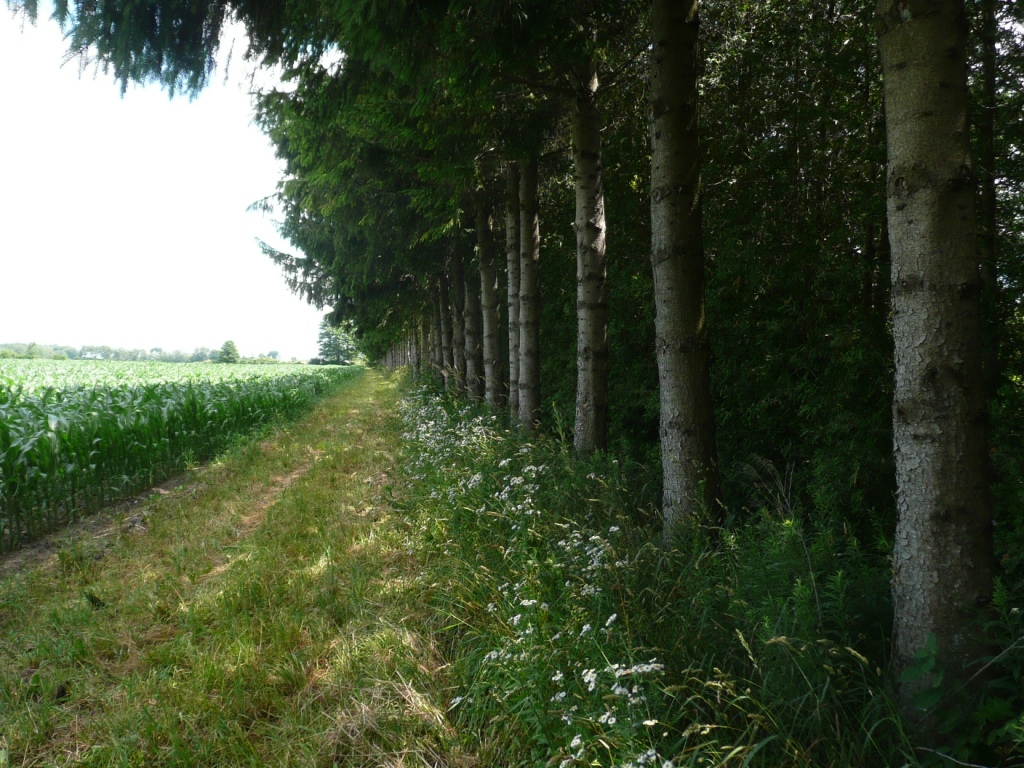
 The many benefits of using windbreaks
Dec 7, 2015:
 25th Annual Ontario Turfgrass Symposium
Dec 1, 2015:
 Do you want to increase your crop yields by 10-15%? Plant a windbreak!
Dec 1, 2015:
 Turf Managers’ Short Course
Nov 24, 2015:

Jul 29, 2015:
 Upcoming Courses and Programs in Turf Management – University of Guelph